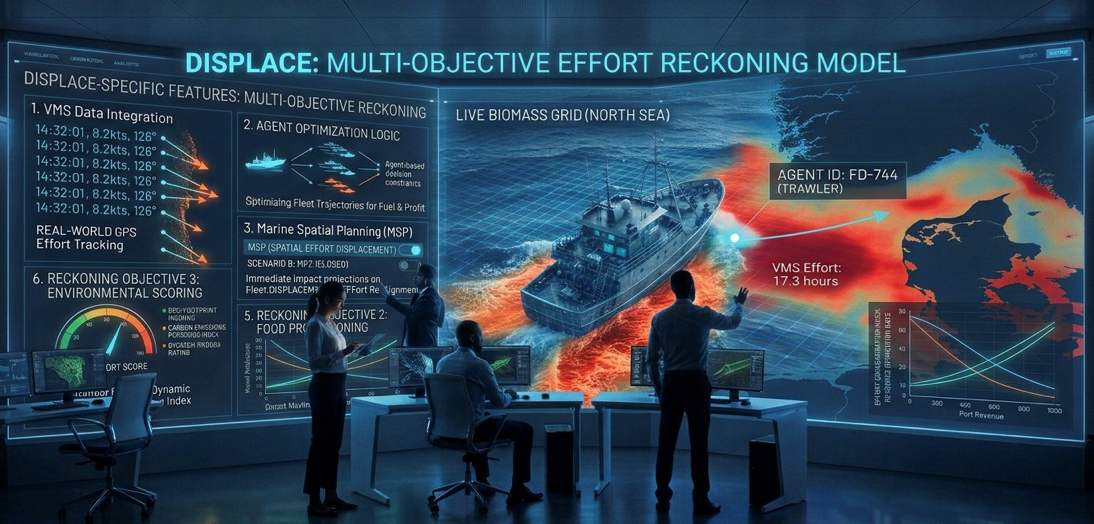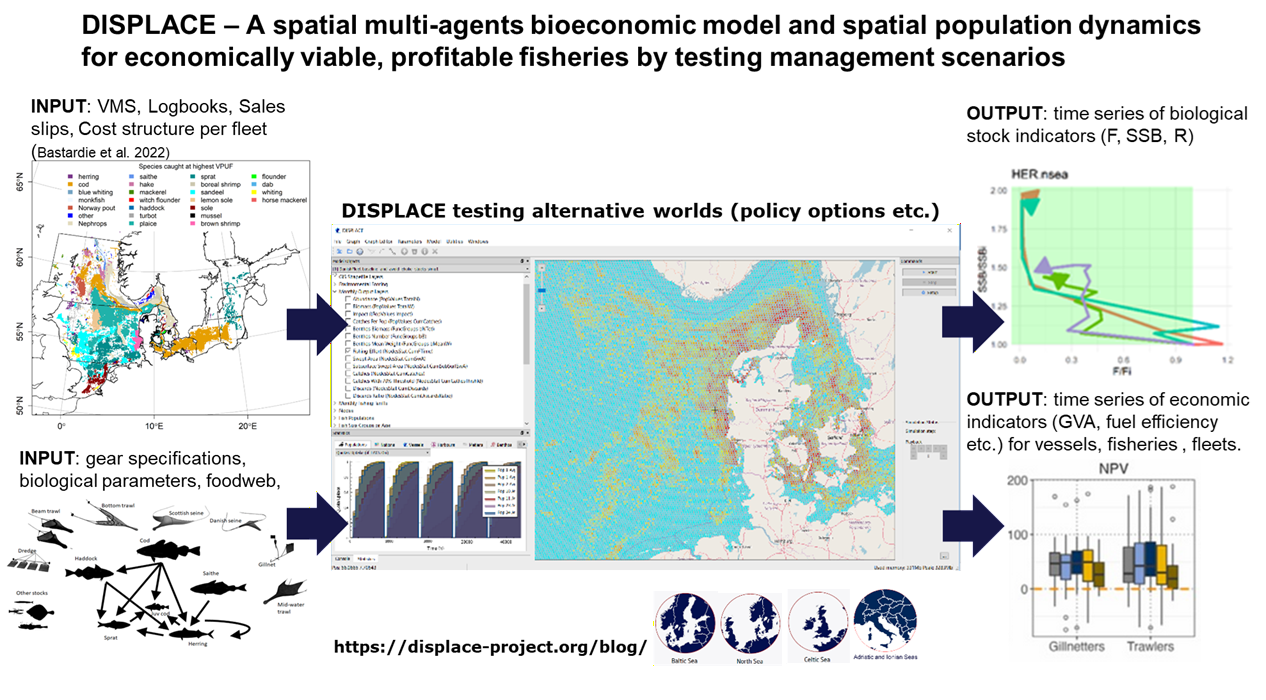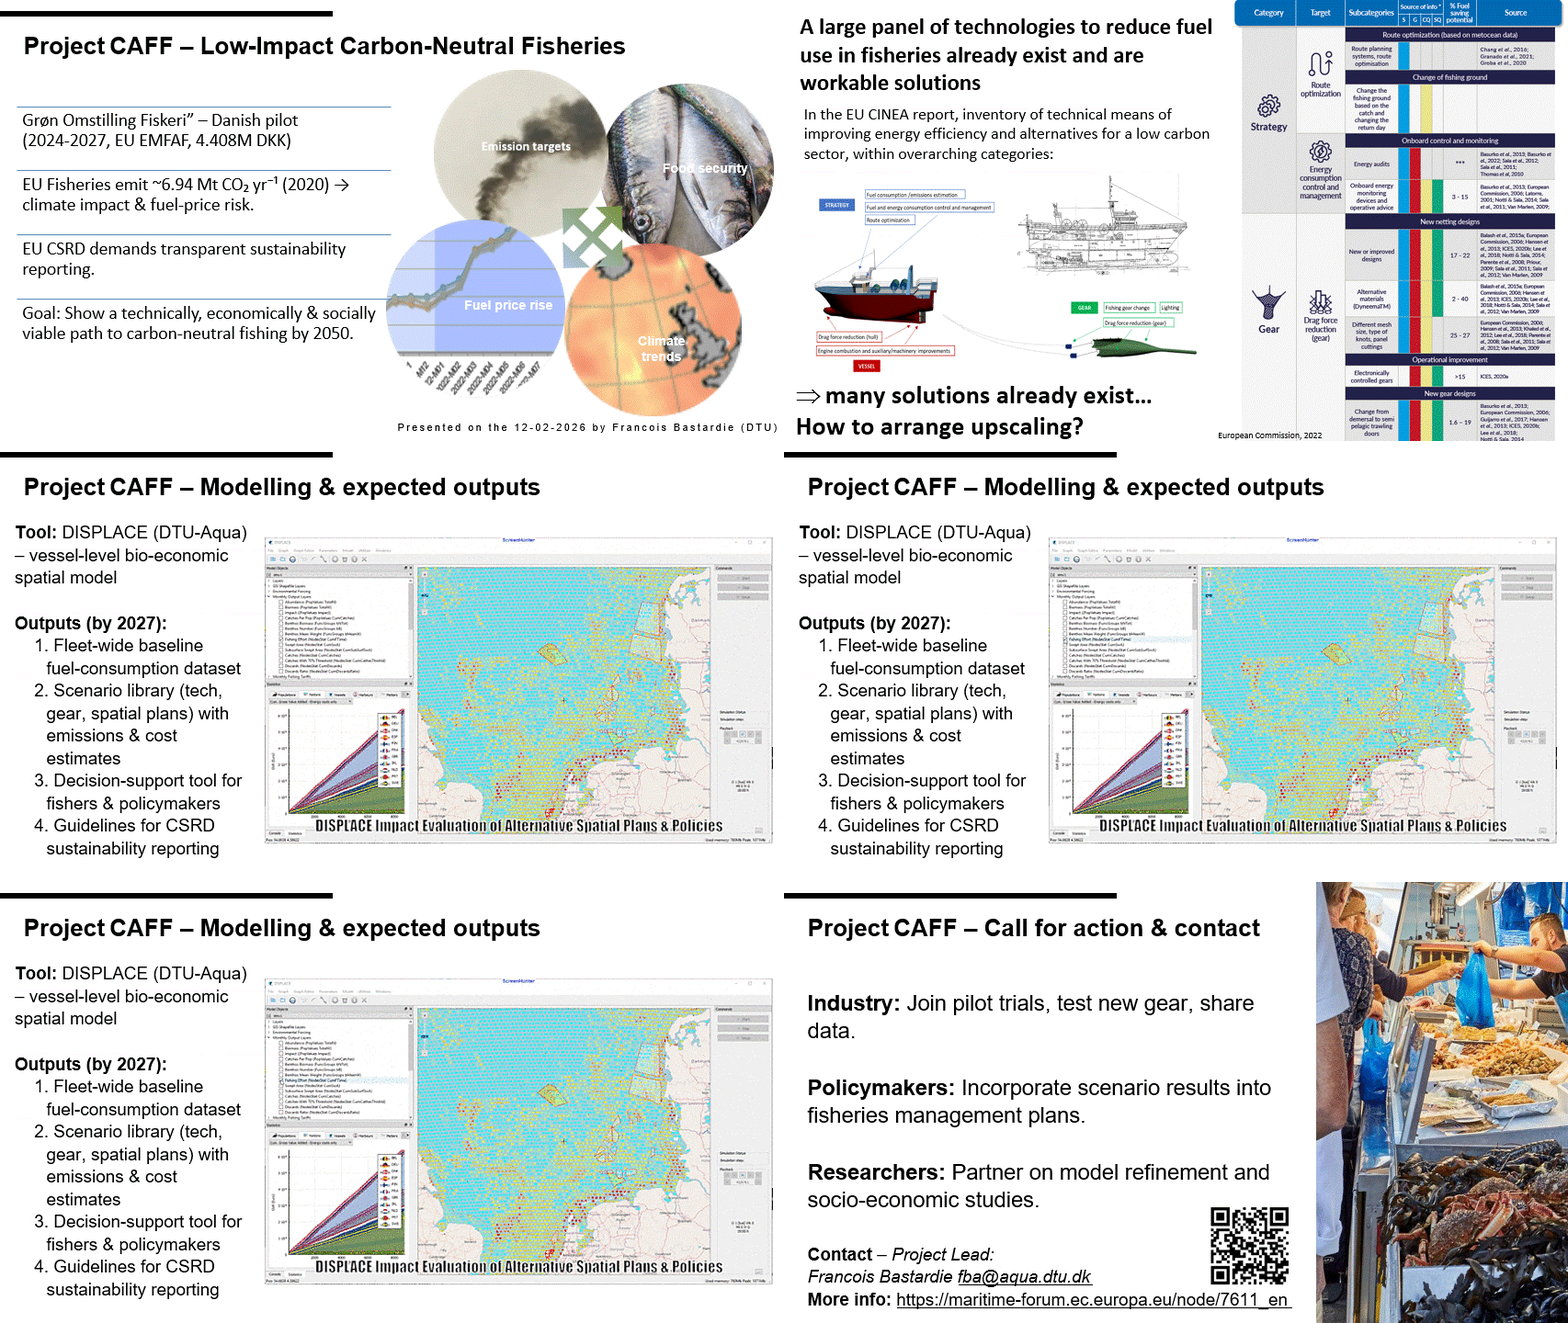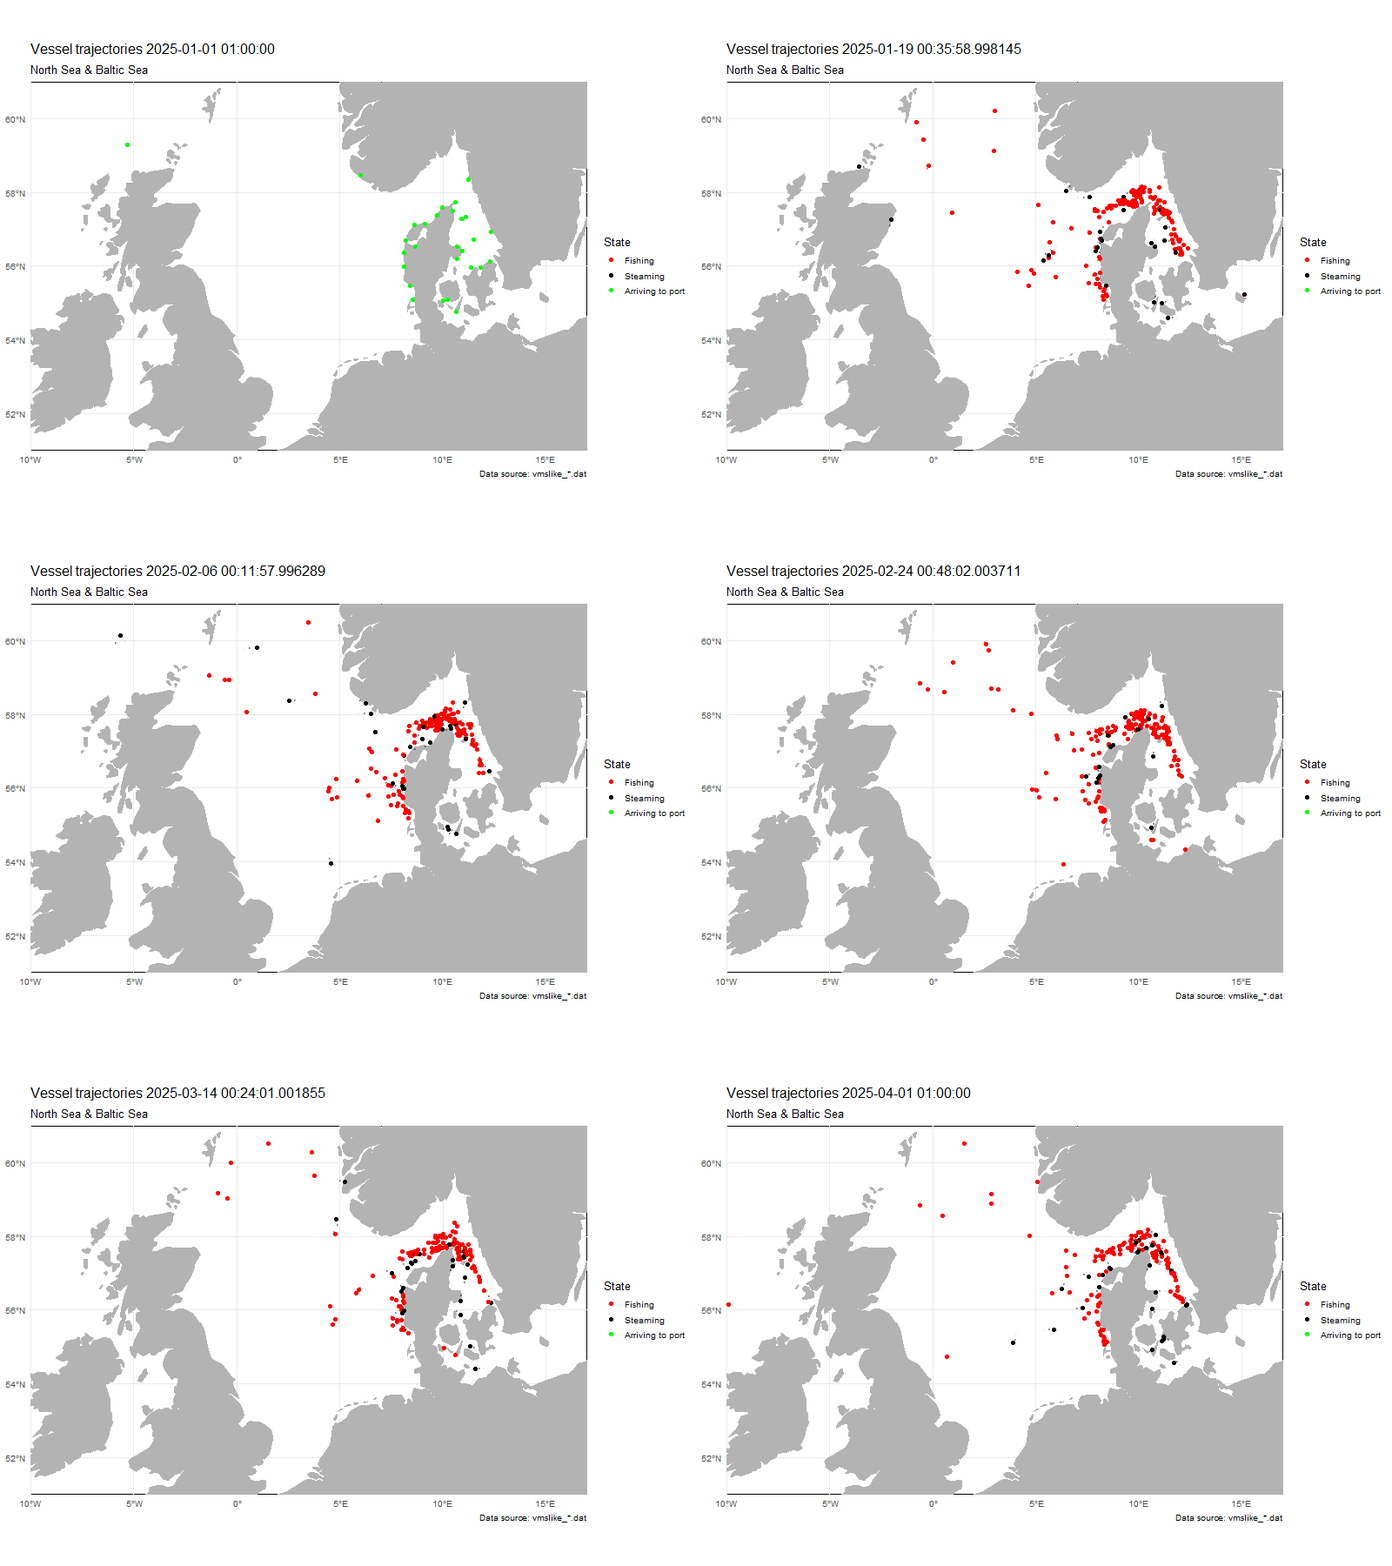
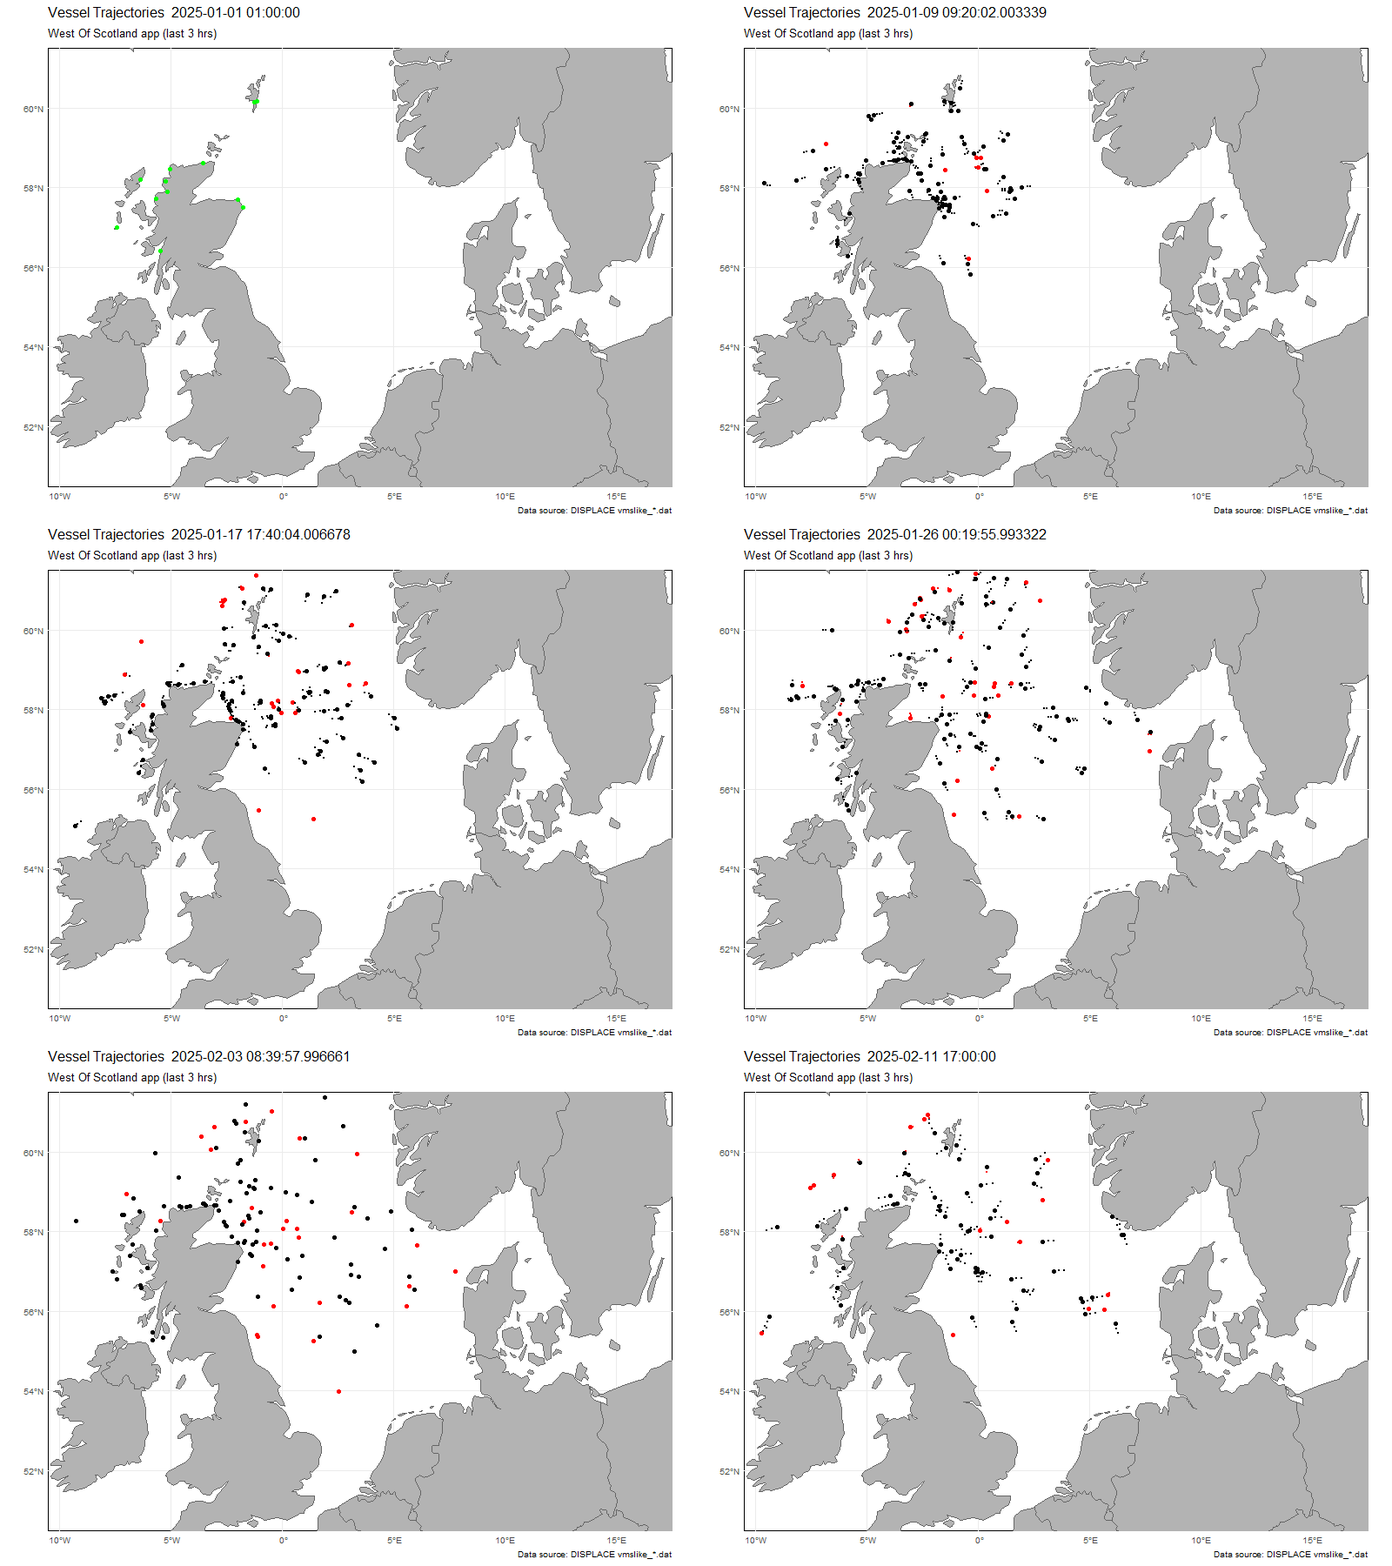
All of the work described below (overview table below) starts from the same place: a skipper deciding where to go fishing next. Not a fleet average, not a grid cell with a fishing intensity in it, but a specific vessel with its own engine, fishing gear, home port, and account to settle at the end of the month. That is what “individual-based” in DISPLACE actually means.
Each fisheries-science model answers a different question, and each has earned its place. Stock assessment models estimate how many fish there are and how hard they are fished, which is the backbone of ICES advice; but because they represent fishing pressure as one number per stock, a closure and a quota cut can look the same to them. Aggregate bio-economic models capture the economics of fleet segments and suit questions where individual behaviour averages out. Static pressure maps show where fishing happens today and are invaluable for that, though by construction they describe a fleet at rest. The questions that motivated this body of work sit between those: which vessels lose their grounds when a rule changes, how far they travel to replace them, what the fuel costs, and where the removed pressure lands instead.
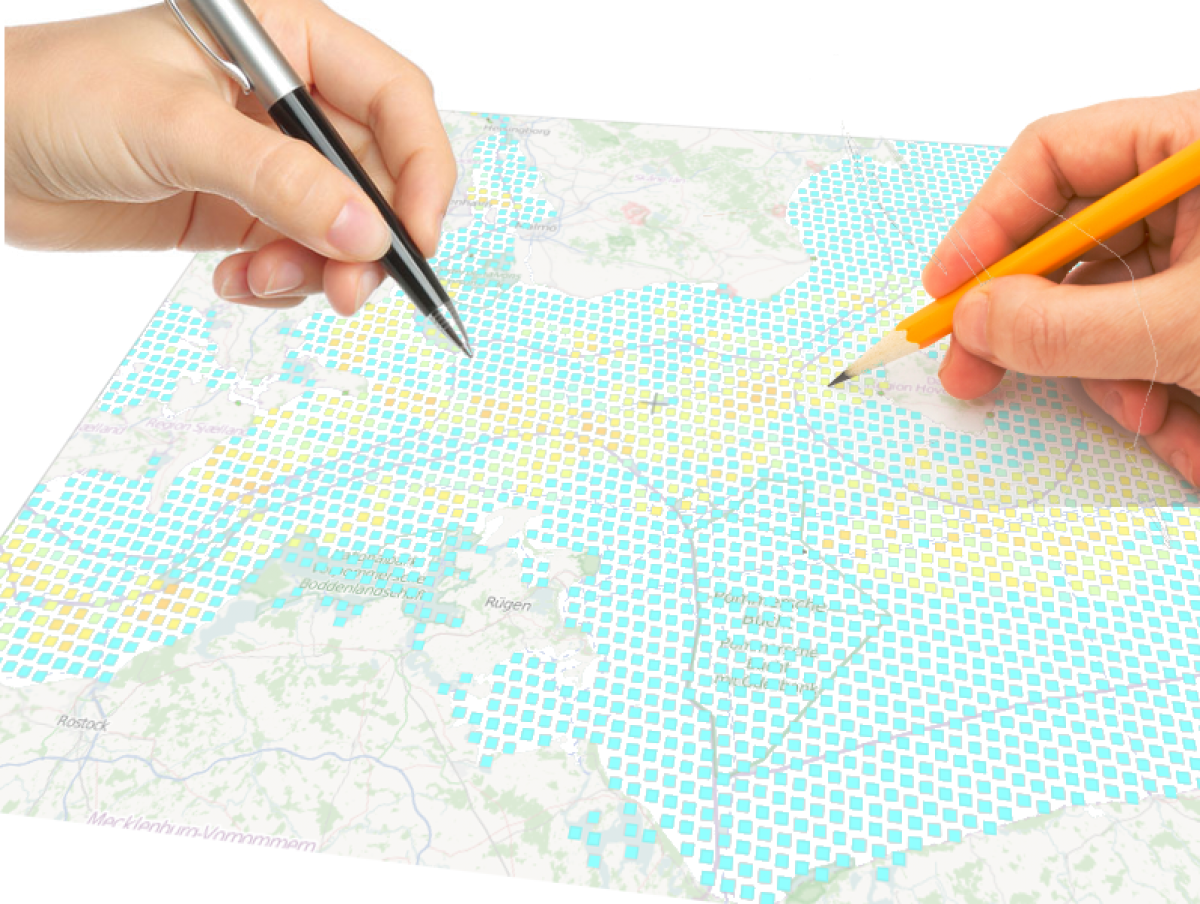
DISPLACE was built for that in-between territory. Conditioned on VMS and logbook data, it simulates each vessel choosing among its known grounds under whatever constraints the scenario imposes, while fish stocks respond spatially to what the fleet does, and the fleet responds back.
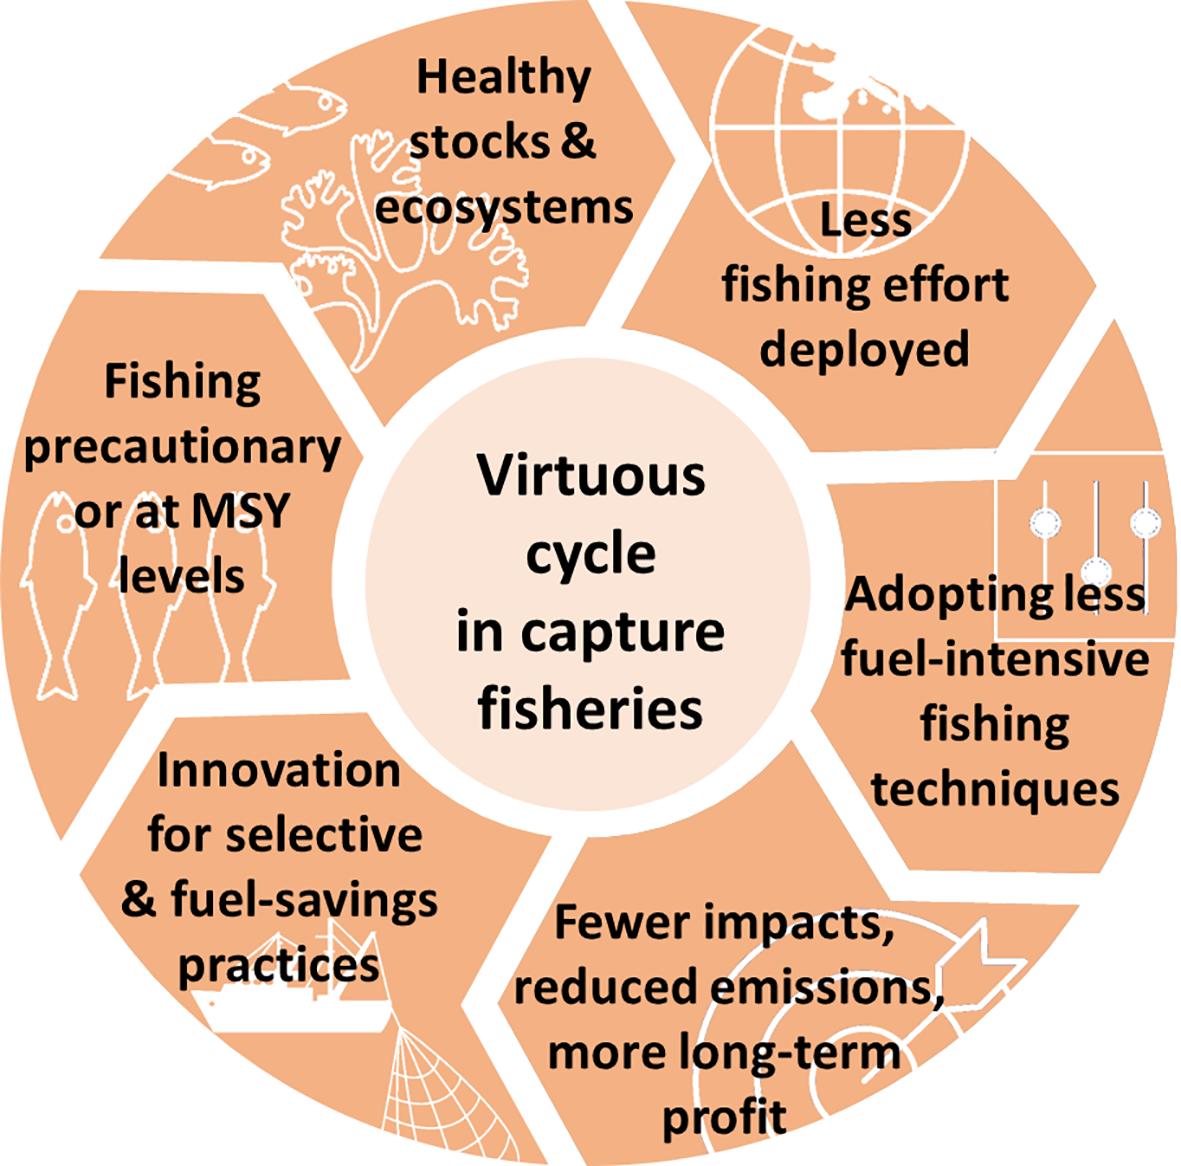
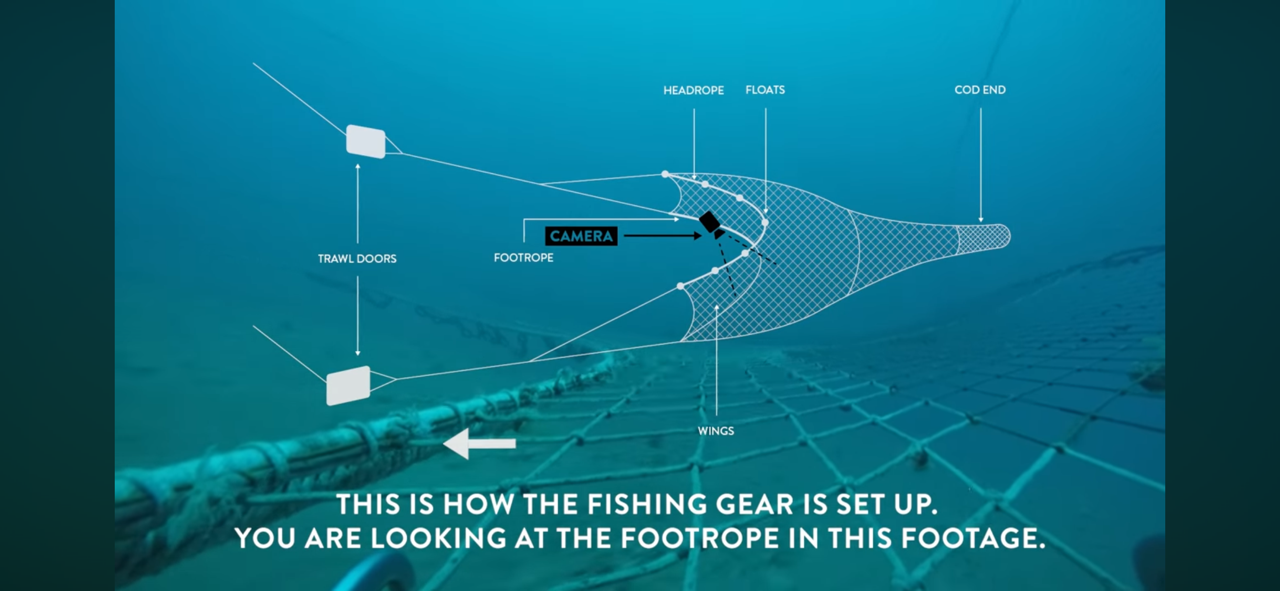
The 2020 Baltic study (Bastardie et al., 2020) gave one of the first warnings: closing an area does not mean the seafloor would recover, because vessels shift to the next best grounds and the added pressure there can offset what the closure gained. Seeing that requires simulating behaviour, not assuming it away. The 2025 SEAwise study (Bastardie et al., 2025) showed the complementary result: blanket trawling bans in all MPAs might cut fleet economics by 25-30%, while restricting trawling only where benthic communities are made up of long-lived animals would cost the fleet little. Telling those two options apart depends on knowing each vessel’s real alternatives. The 2022 fuel paper (Bastardie et al., 2022) stated that rebuilt stocks would cut fuel use more than new gear would do, because fuel is spent trip by trip and better catch shortens trips. CAFF and MarineGuardian projects now extend that accounting to fleet renewal and decarbonisation scenarios, helping the sector to commit to a transition path.
Meanwhile, the model keeps travelling 🙂 the Ionian Sea (Maina et al., 2021), western Baltic cod (Rufener et al., 2023), deep-sea VME closures weighed in STECF advice, and offshore wind leases off California, the latter where there is not even a fishing measure tested but someone else claiming the sea.
Looked at together, the arc of these papers is about finding the right unit of analysis for the question at hand. Stock models count fish, economic models track fleets, pressure maps map square kilometres. Some questions need all three scales at once: a skipper’s reaction, the next ground chosen, the fuel burned, the fish removed, the seafloor swept. As policy keeps redrawing the map of European seas, decisions are made at that scale, vessel by vessel.
DISPLACE (2020–2026)
| project number | Individual Vessels | Effort displ. | Fish pop. dyn. | Bio-econ. | Energy/climate | Benthos/seafloor | MSE spatial plans | Region |
|---|---|---|---|---|---|---|---|---|
| [1] | ● | ● | ● | ● | ○ | ● | ● | Baltic/Kattegat |
| [2] | ○ | ● | ● | ● | ● | ● | ● | EU-wide |
| [3] | ● | ● | ● | ● | ○ | ○ | ● | Ionian Sea |
| [4] | ● | ○ | ● | ● | ● | ○ | ○ | EU/North Sea |
| [5] | ○ | ○ | ○ | ○ | ● | ○ | ● | EU-wide |
| [6] | ● | ● | ● | ● | ○ | ○ | ● | North Sea |
| [7] | ● | ● | ● | ● | ○ | ○ | ● | W. Baltic |
| [8] | ● | ● | ● | ● | ○ | ○ | ○ | NE Atlantic |
| [9] | ● | ● | ○ | ● | ○ | ● | ● | EU deep-sea, NE Atlantic |
| [10] | ● | ● | ○ | ● | ○ | ● | ● | EU-wide |
| [11] | ○ | ● | ● | ● | ● | ○ | ● | EU-wide |
| [12] | ● | ● | ● | ● | ○ | ● | ● | NE Atl. + Med |
| [13] | ● | ○ | ● | ● | ● | ○ | ● | Denmark to Atlantic & Arctic |
| [14] | ● | ● | ○ | ● | ○ | ● | ● | E. Mediterranean |
| [15] | ● | ● | ● | ● | ● | ○ | ● | California |
● = core; ○ = secondary.
[1] Bastardie et al. 2020, Fish. Res. 230:105681 (Baltic seafloor)
[2] Bastardie & Brown 2021, Mar. Policy 126:104409 (fleet policy risk assessment)
[3] Maina et al. 2021, Ocean & Coast. Manag. (Ionian spatial plans)
[4] Bastardie et al. 2022, Front. Mar. Sci. 9:817335 (fuel use intensity)
[5] Bastardie et al. 2022, Front. Mar. Sci. 9:947150 (CFP ten lessons)
[6] Bastardie 2022, NORDFO report (North Sea)
[7] Rufener et al. 2023, Fish. Res. 268:106853 (W. Baltic cod Essential Fish Habitats)
[8] Vastenhoud et al. 2023, Front. Mar. Sci. 10:1285793 (mesopelagic fish exploitation)
[9] VME socio-economic impact assessment (STECF advice 2023; EWG-24-09; EWG March 2025; Reg. (EU) 2022/1614 closures)
[10] STOA 2024, PE 762.843 (innovative tech for bottom trawling in MPAs?)
[11] Bastardie et al. 2024, Front. Mar. Sci. 11:1352500 (roadmap, changing ocean)
[12] Bastardie et al. 2025, Front. Mar. Sci. 12:1629180 (SEAwise, EU closures)
[13] Bastardie et al. 2026, Front. Mar. Sci. 13:1812898 (fleet renewal & energy transition)
[14] Tsikopoulou et al. 2026, https://doi.org/10.3389/fmars.2026.1769853 Front. Mar. Sci. 13:1769853 (E. Med benthic status)
[15] California offshore wind application (ongoing, w/ UCSB EM Lab)